
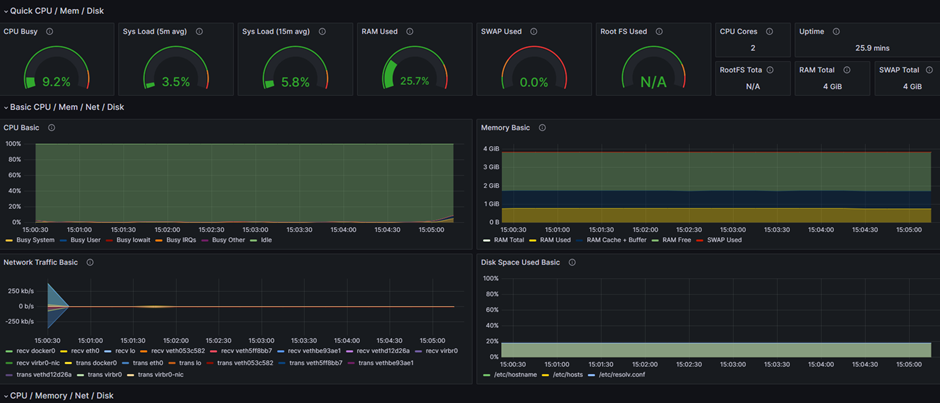
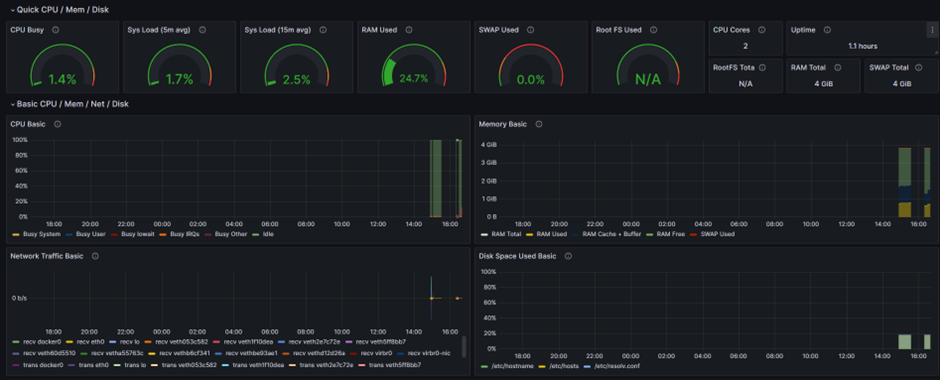
Today I will show you how to monitor your host (Linux CentOS) using Grafana with Prometheus and Node-exporter. At the end of this post, you will be able to see a dashboard like the one below.
In the previous post, I showed the process of configuring a Docker container to host an NGINX Web Server. Now, I will show you how to monitor the health of a Linux host, such as CPU usage, memory allocation, disk utilization, and more. This monitoring task involves deploying three additional containers:
1- Prometheus: A monitoring and alerting toolkit designed to gather metrics from various targets, store them, and make them available for querying and visualization.
2- Node Exporter: A Prometheus exporter that collects system-level metrics from *NIX kernels, enabling monitoring of hardware and OS performance.
3- Grafana: A platform for creating, exploring, and sharing dashboards, ideal for visualizing Prometheus metrics and monitoring data.
Start by creating the folders to better organizer your configuration.
mkdir Projects && cd Projects && mkdir prometheus && cd prometheus
Create a file called “Dockerfile” either by creating the file (touch command) and editing it or use “vi” to create and edit.
vi Dockerfile
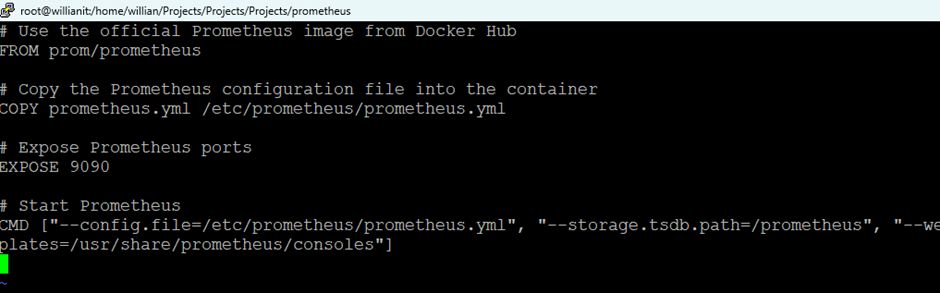
Copy the below config and save the file. If using “vi”, save with “:wq!”. The below config is the minimum needed to run the docker.
# Use the official Prometheus image from Docker Hub

FROM prom/prometheus


# Copy the Prometheus configuration file into the container

COPY prometheus.yml /etc/prometheus/prometheus.yml


# Expose Prometheus ports

EXPOSE 9090


# Start Prometheus

CMD ["--config.file=/etc/prometheus/prometheus.yml", "--storage.tsdb.path=/prometheus", "--web.console.libraries=/usr/share/prometheus/console_libraries", "--web.console.templates=/usr/share/prometheus/consoles"]
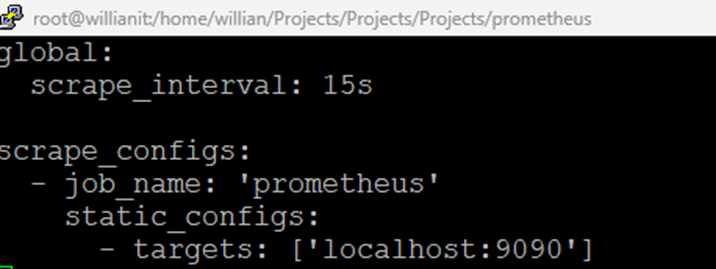
Create a new file that will be used by the container called prometheus.yml
vi prometheus.ymlCopy the below and save (:wq!) if using “vi”.
global:

  scrape_interval: 15s


scrape_configs:

  - job_name: 'prometheus'

    static_configs:

      - targets: ['localhost:9090']
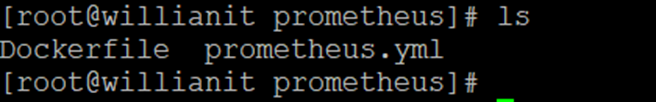
Confirm you have both files created using the “ls” command.
Build the prometheus container docker.
docker build -t prometheus .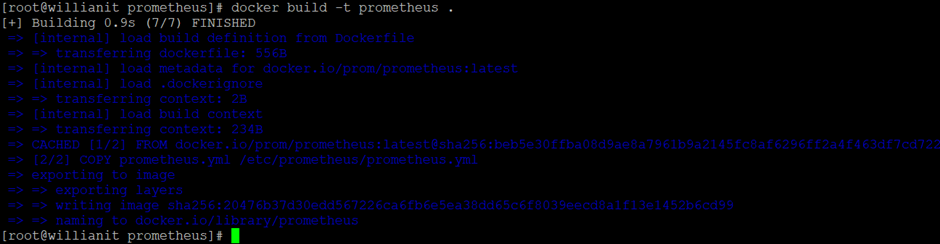
Now, start the container. The container will run on port 9090.
docker run -d -p 9090:9090 --name prometheus -v /Your/Location/prometheus.yml:/etc/prometheus/prometheus.yml Prometheus
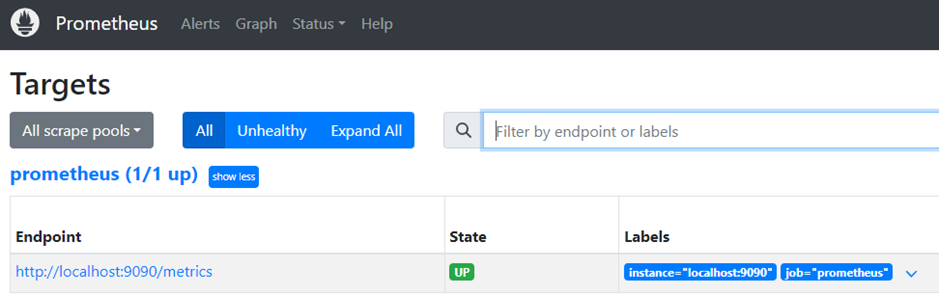
Open a browser, and type “Your-Linux-IP:9090”. You will see the Prometheus page. Go to Status > Targets.
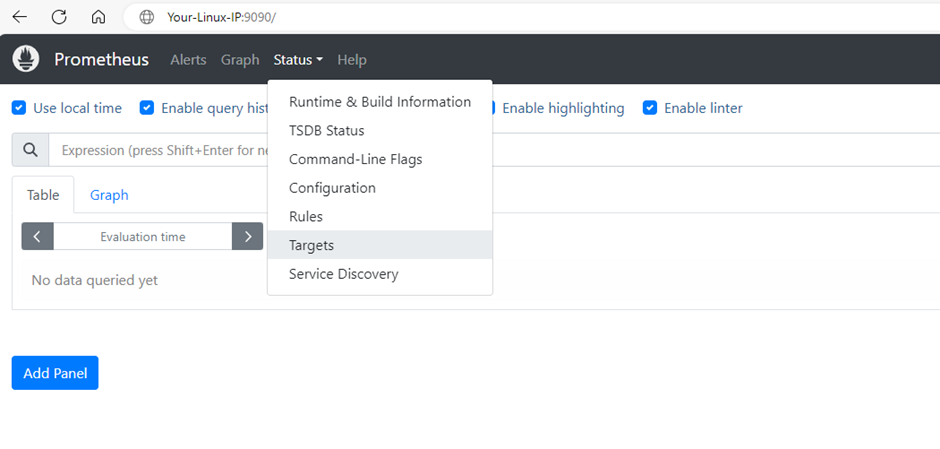
You should see the endpoint (prometheus) as UP.
Now, you need to start a new container (node exporter) that will plot data to Prometheus. To do so, pull the docker image.
docker pull prom/node-exporter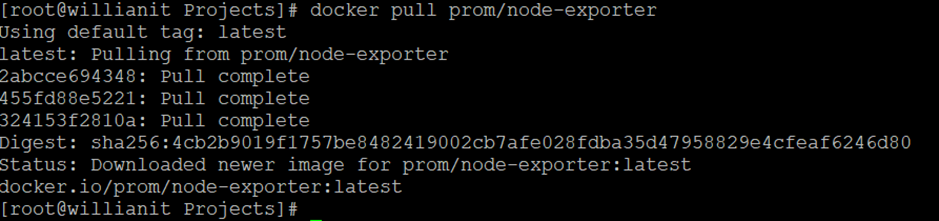
Run the docker image. The node exporter will run on 9100 port.
docker run -d -p 9100:9100 --name node-exporter --net="host" prom/node-exporter
You will need to edit the “prometheus.yml” file to add the node exporter config. Save the file.
vi prometheus.yml Add the job_name for your exporter. You can add any name.
 - job_name: 'node-exporter'

    static_configs:

      - targets: ['Your-Linux-IP:9100']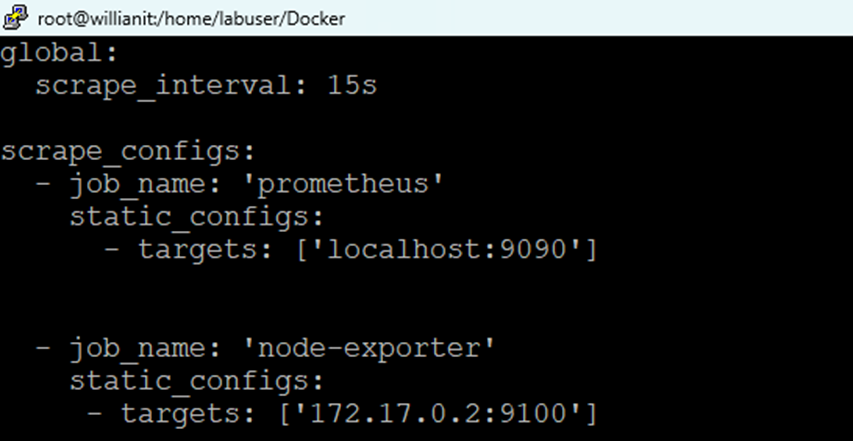
Now, you will need to restart the prometheus docker to load the new config. To do so, start grabbing the “container id” and then restarting it.
docker ps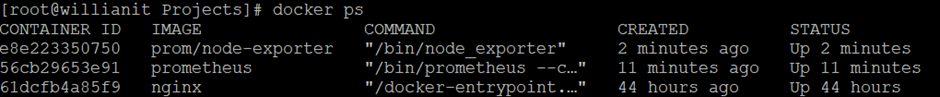
docker restart YOUR-CONTAINER-ID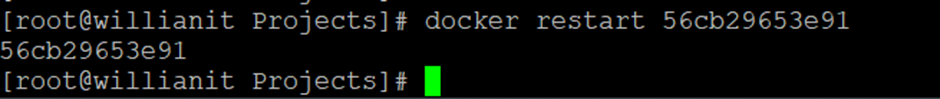
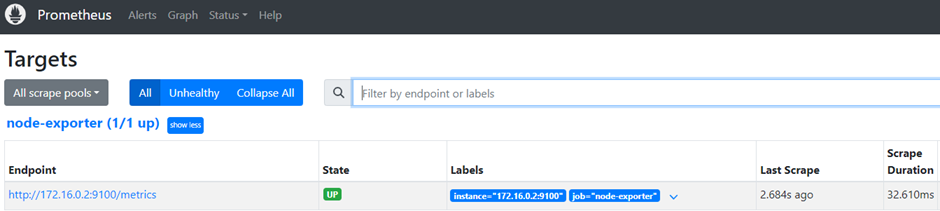
Return to the Prometheus page and refresh it. You should see your new target and that should be UP.
If everything is working fine, you will be able to run some queries and see the health of your host.
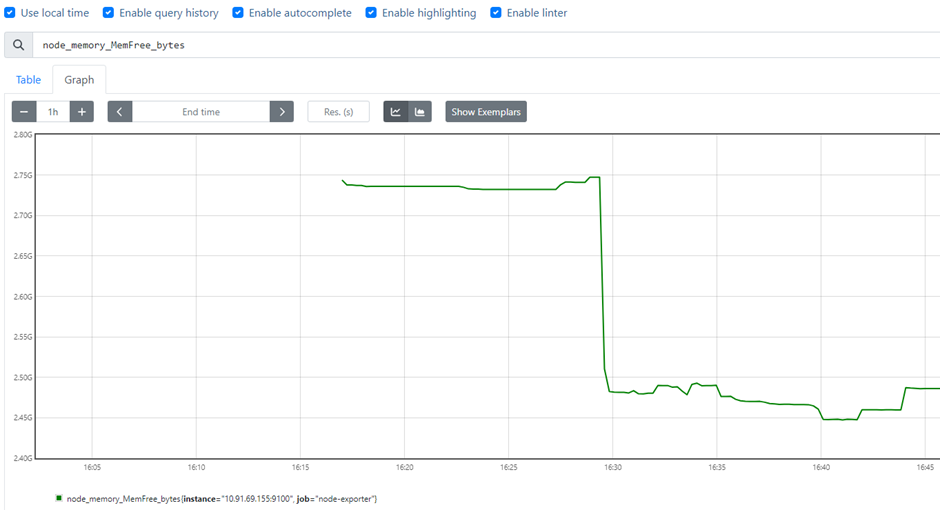
At this point, you could start doing your queries and see the heath of your server, however, Grafana can help creating nice Dashboards 🙂
To do so, pull the Grafana image
docker pull grafana/grafana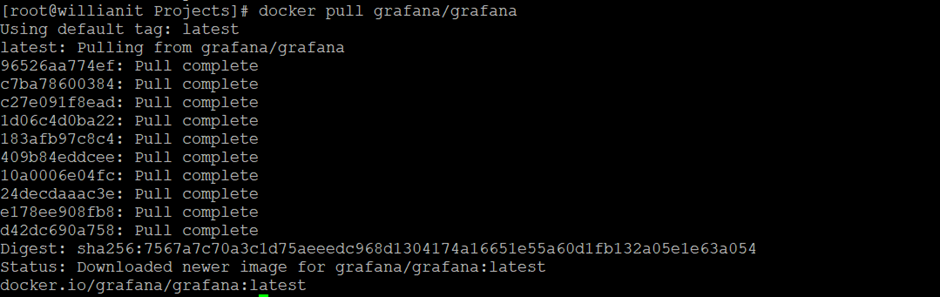
Run the Grafana docker. The Grafana will run on port 3000.
docker run -d --name=grafana -p 3000:3000 grafana/grafana
Confirm your Grafana docker is running.
docker ps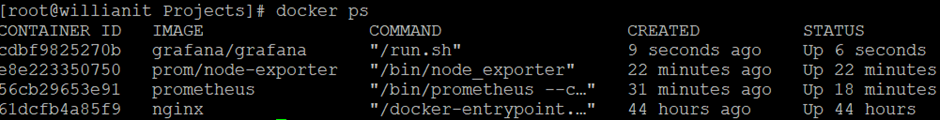
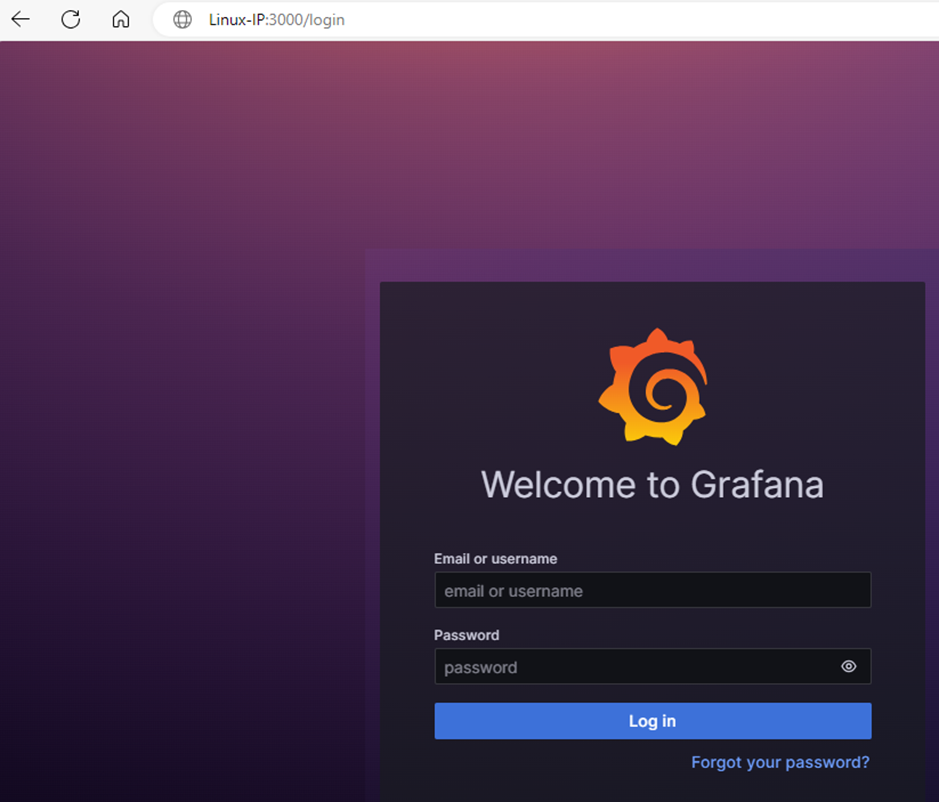
Open your browser and type Your-Linux-IP:3000 to open the Grafana. Use admin/admin to log in.
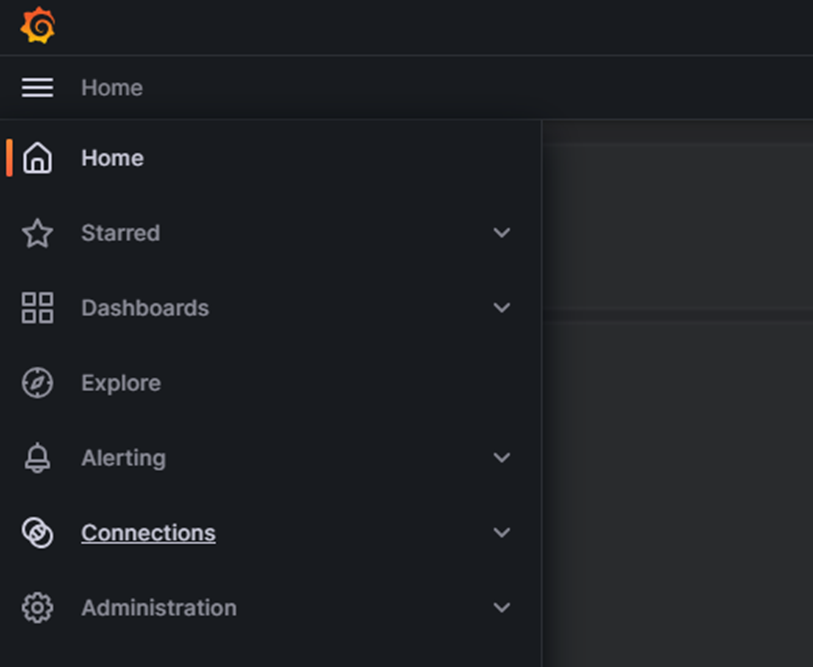
From the “hamburger menu”, click Connections.
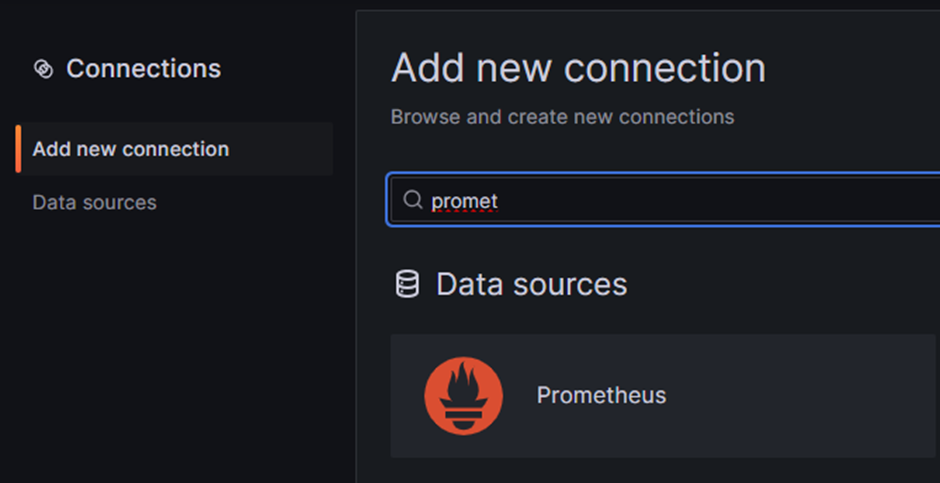
From “Add new connection”, search for Prometheus.
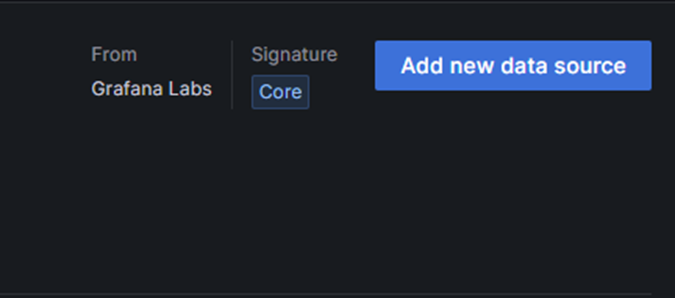
Click “Add new data source”
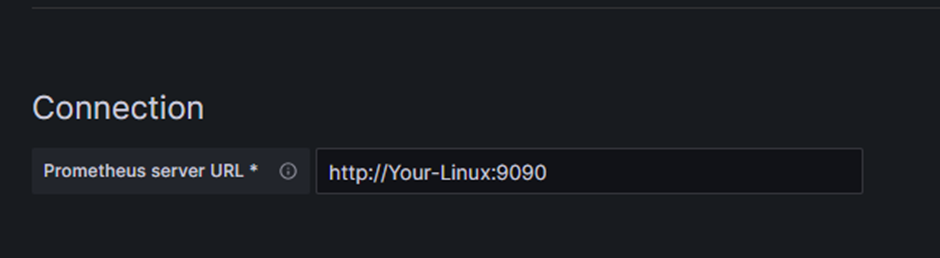
Under connection, type your http://linux-ip:9090
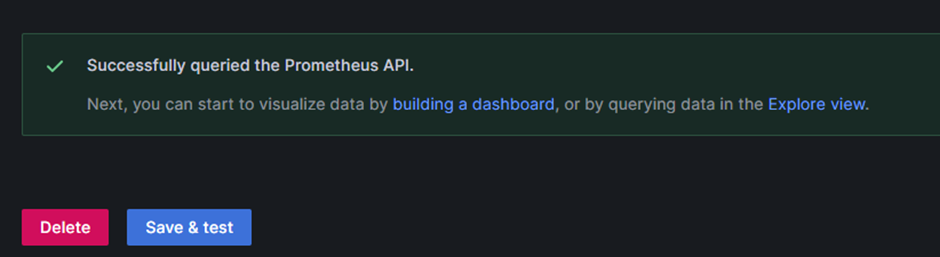
Scroll down the page and click “Save & test”. You should see “Successfully queried the Prometheus API”.
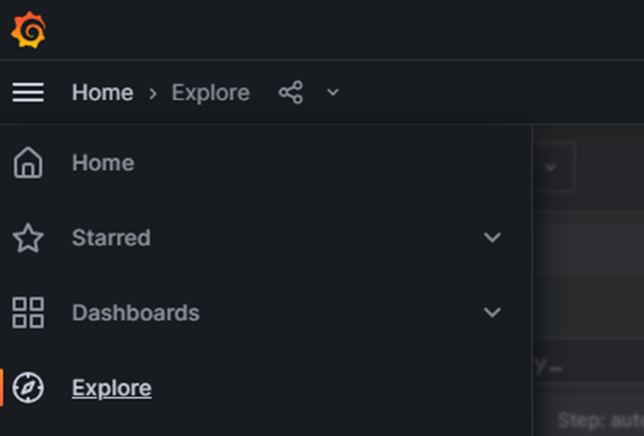
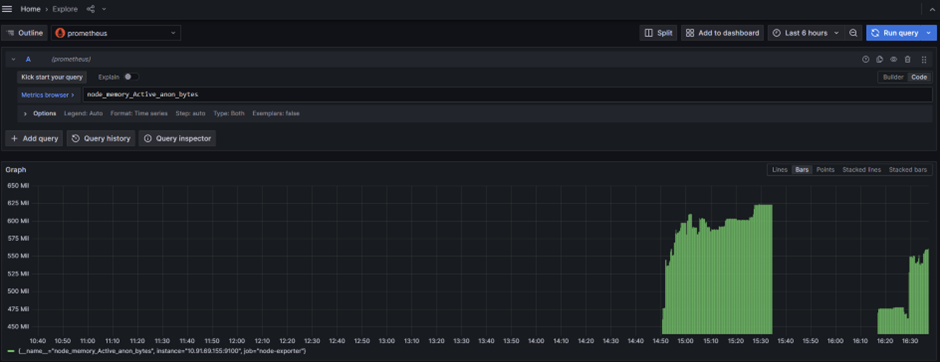
From the “hamburger menu”, click Explore.
From here you can also query cpu/memory/disk..
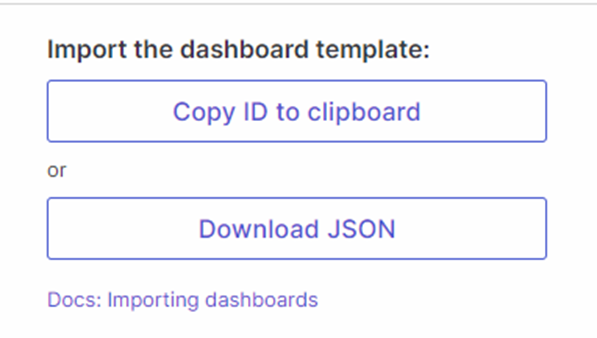
To eliminate the necessity of manually creating dashboards and queries, you have the option to download the Node Exporter dashboard directly from Grafana. This prebuilt dashboard encompasses the majority of the metrics required.
(https://grafana.com/grafana/dashboards/1860-node-exporter-full/)
You can either copy the ID of the dashboard or download the JSON file. In my case, I will copy the ID.
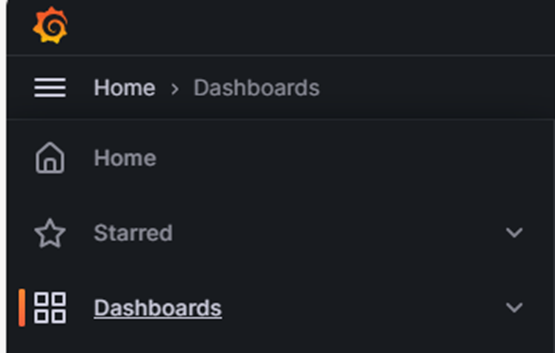
From the Grafana page, navigate to “Dashboards”.
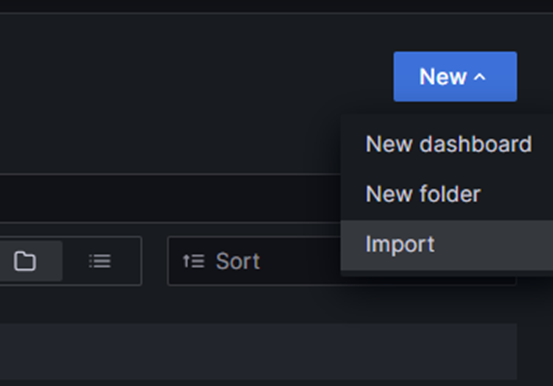
From “new”, click “Import”.
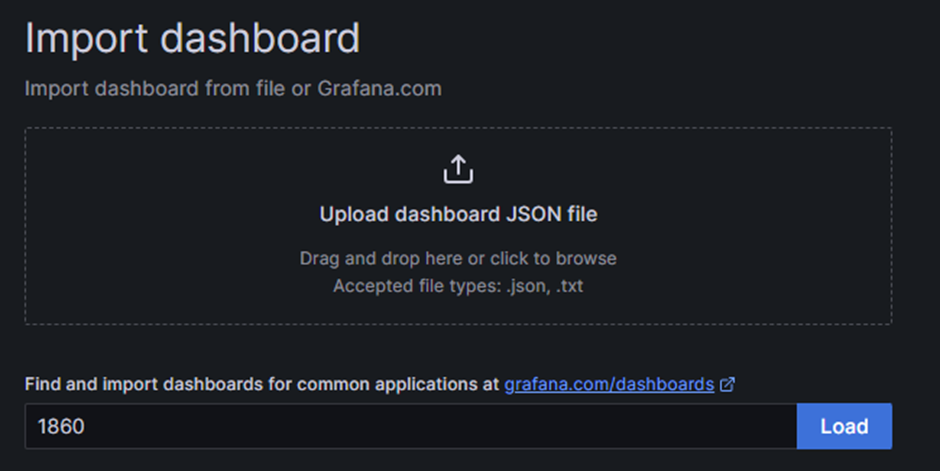
You can from here, upload the dashboard if it was downloaded before or enter the ID copied.
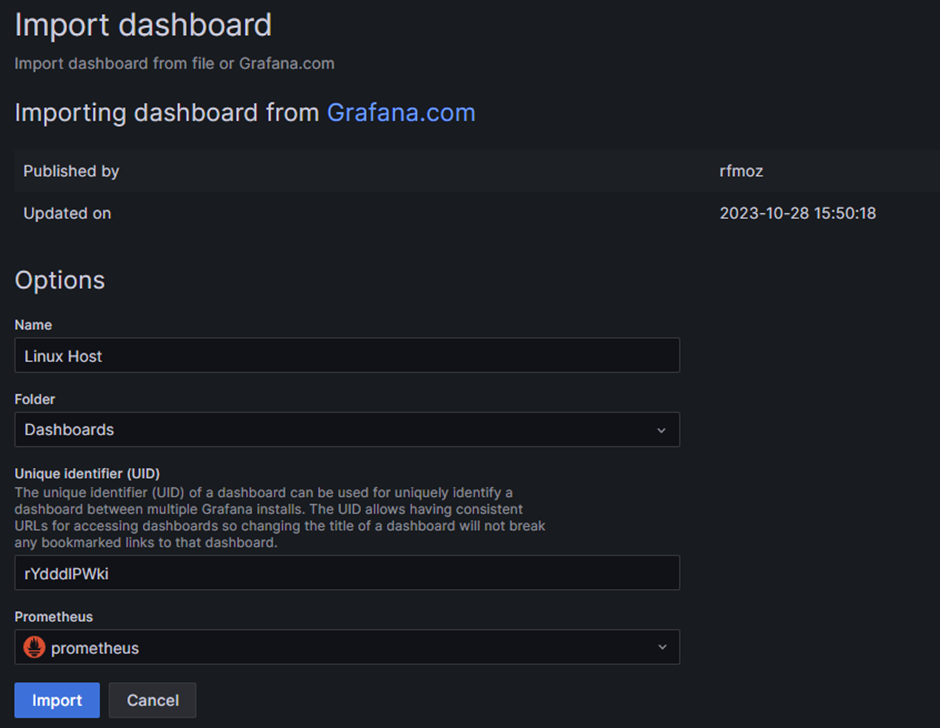
Select “prometheus” and click Import.
Your Dashboard is created and ready.
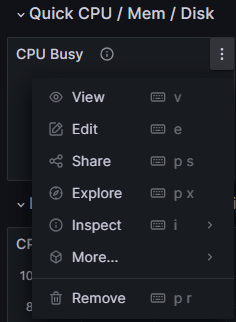
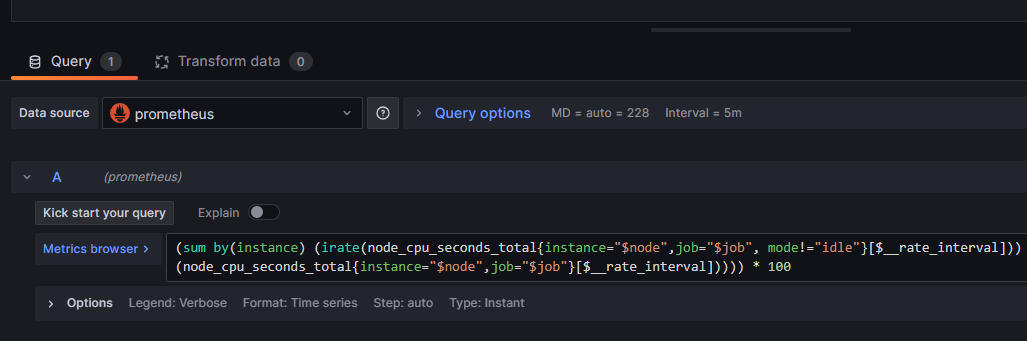
If you edit one of the metrics, you will see the query that is being used to collect that information displayed.
From the right side of the page, you can change the way you wish to display the info on the dashboard.
That’s all for today 🙂


Leave a Reply